Click on the Thumbnail Image on the Right to Download the File |
| Adobe PDF & Microsoft Word Files | Picture Files & Excel Spreadsheet Files |
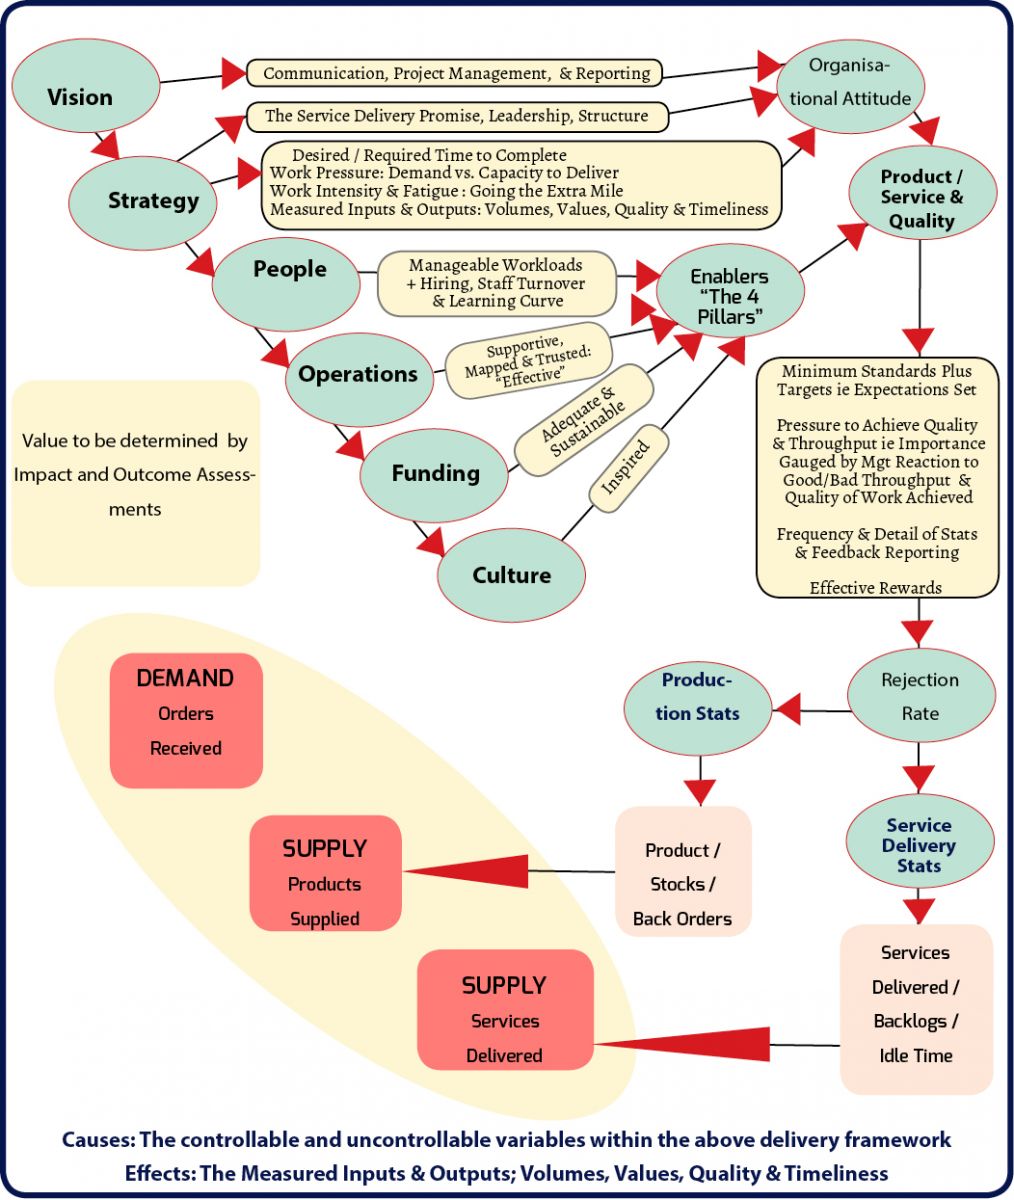
Chapter 2: Focus A Cause & Effect Relationship Diagram: Inputs & Outputs - Throughput & Quality | | |
Chapter 2: Focus Illustrations | | |
As above: Table 5: The same Cause & Effect Relationship Diagram but as presented in the e-book. This version is in portrait format. The above version is in landscape format. | | |
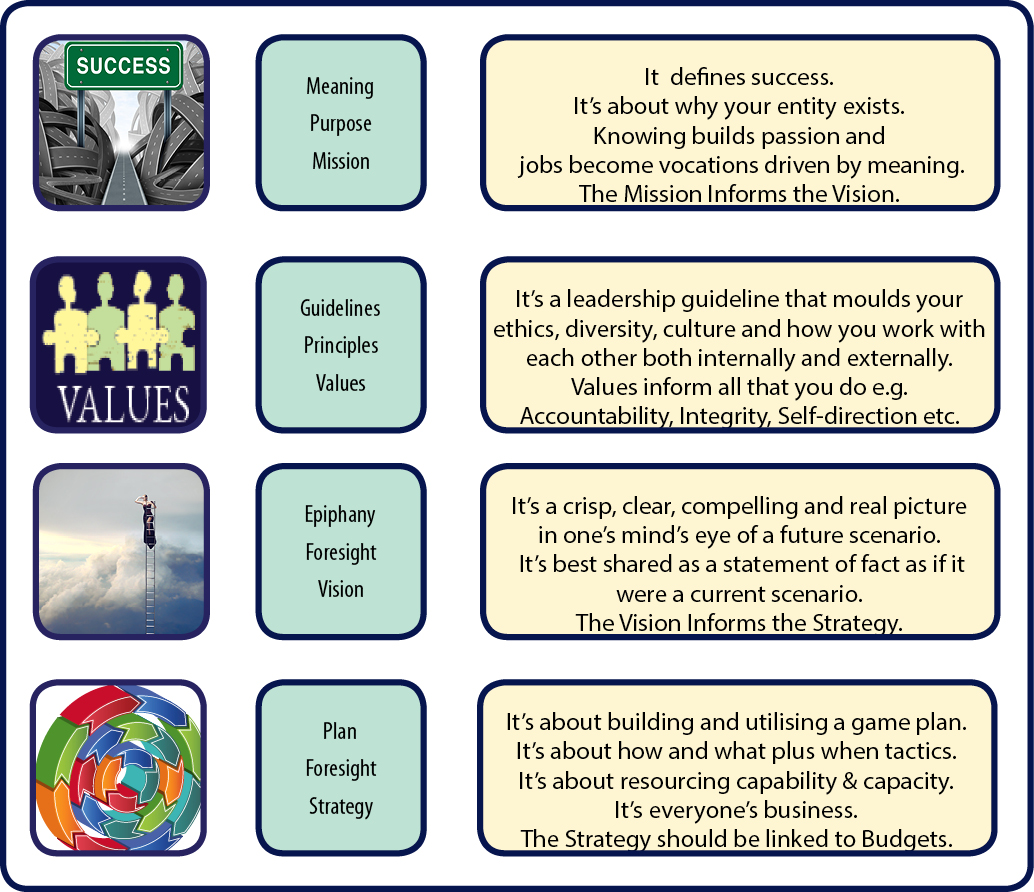
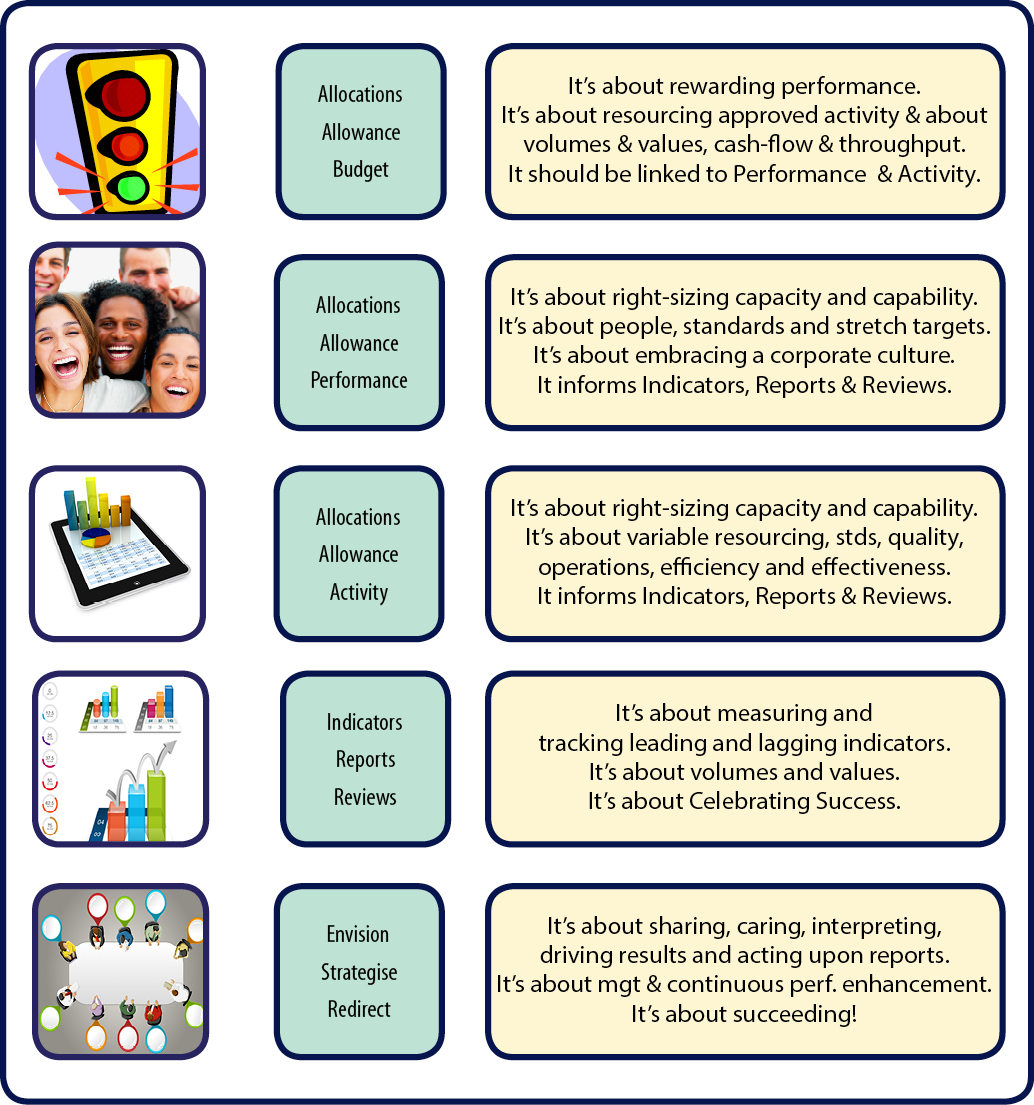
Chapter 2 & Chapter 8: Table 3: Transformation Business Model | | |
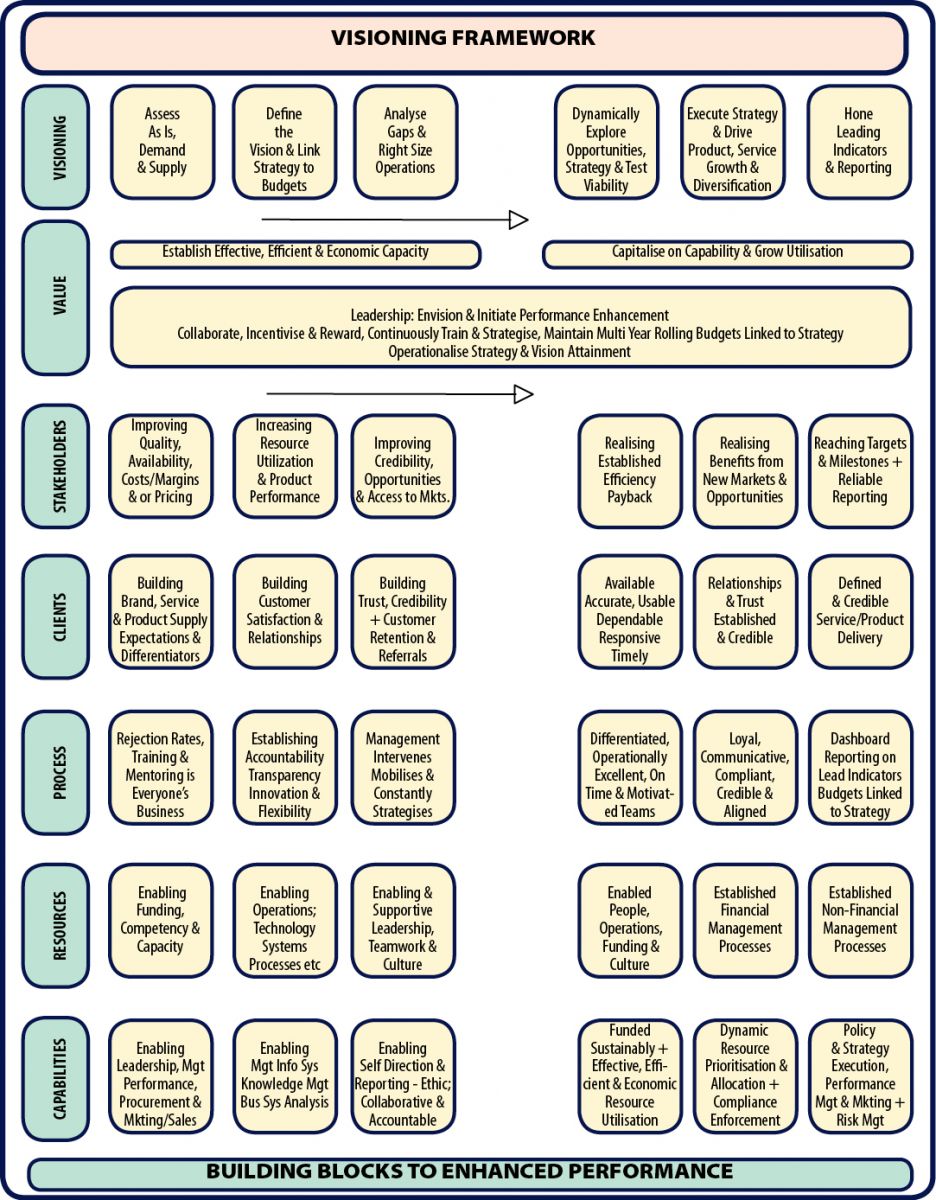
Chapter 2: Table 4: Visioning Framework | | |
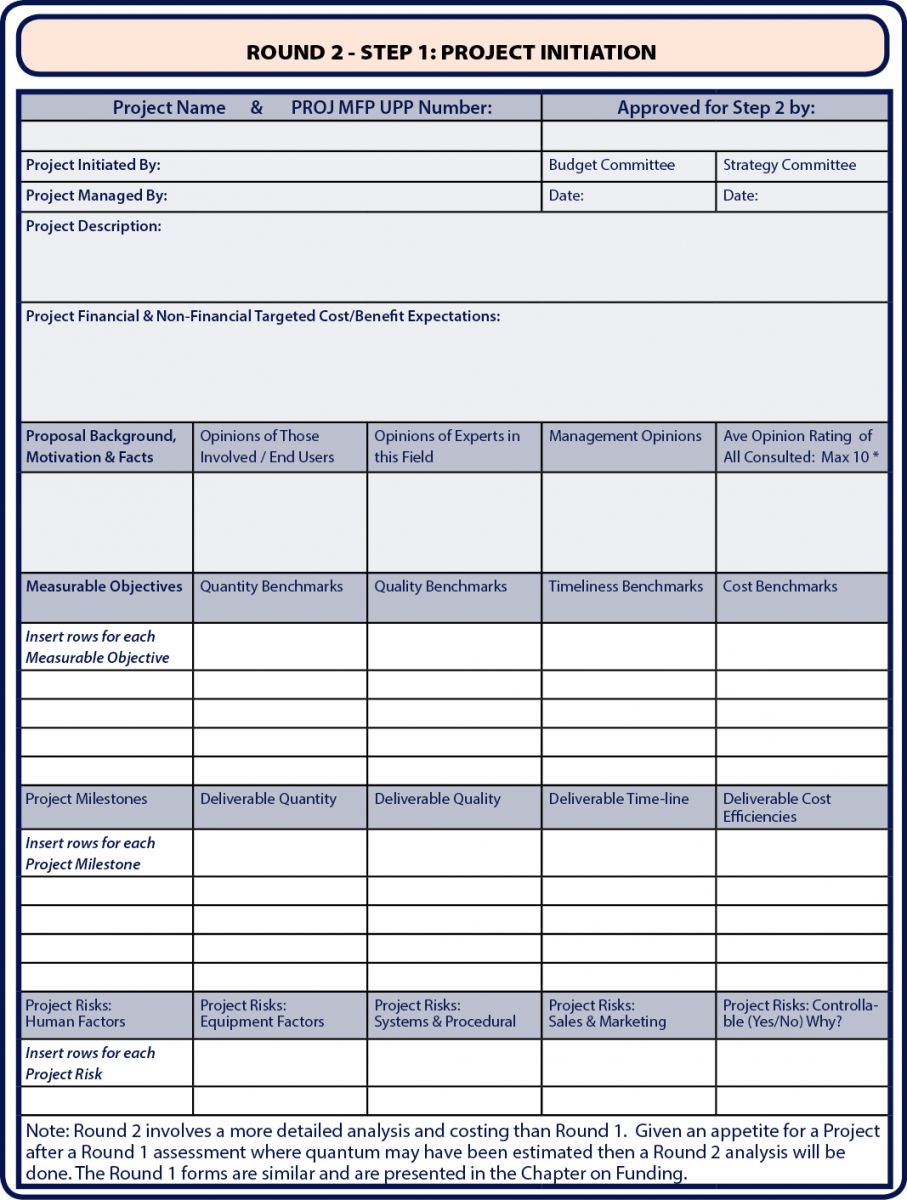
Chapter 2: Table 5: Round 2 - Step 1 | | |
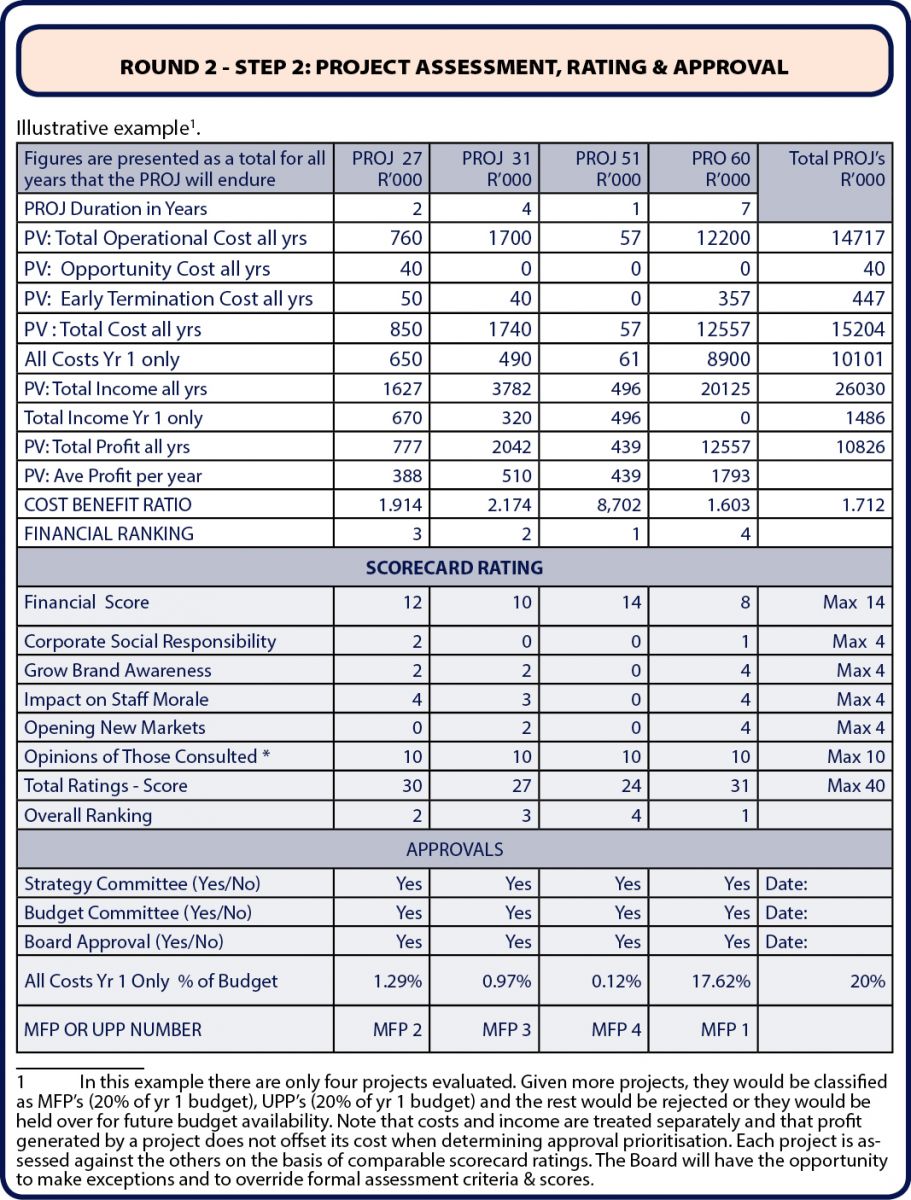
Chapter 2: Table 6: Round 2 - Step 2 | | |
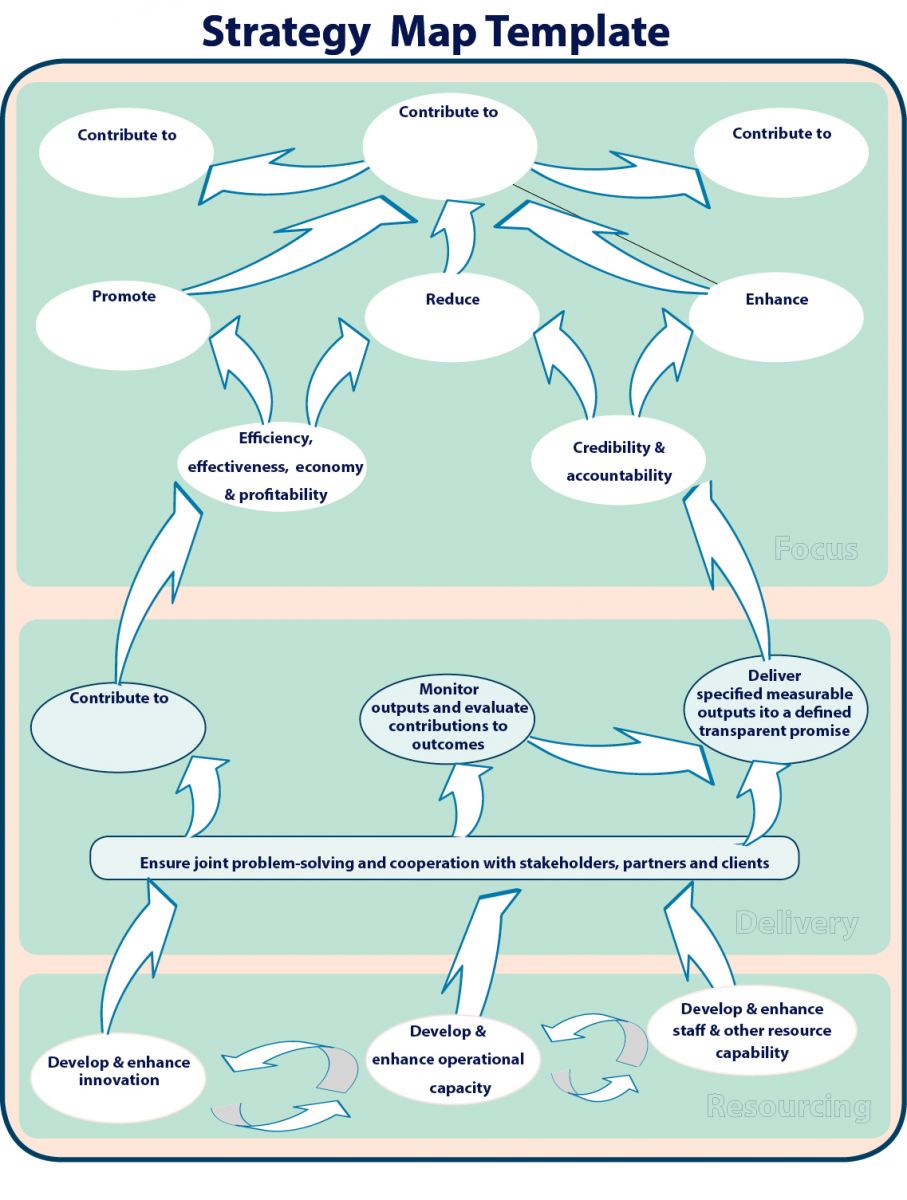
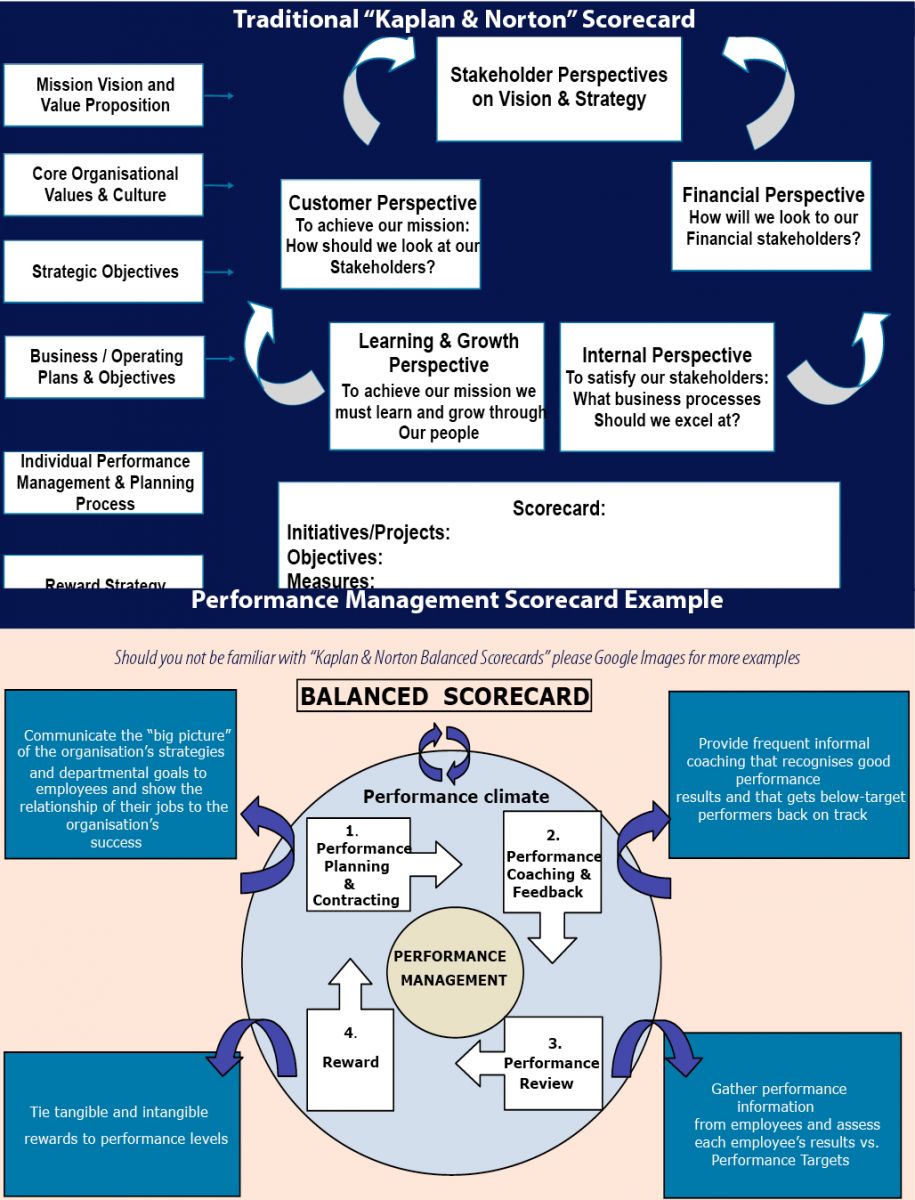
Chapter 3: Table 9: Strategy Map Template and Table 8: Traditional Kaplan & Norton Maps | | |
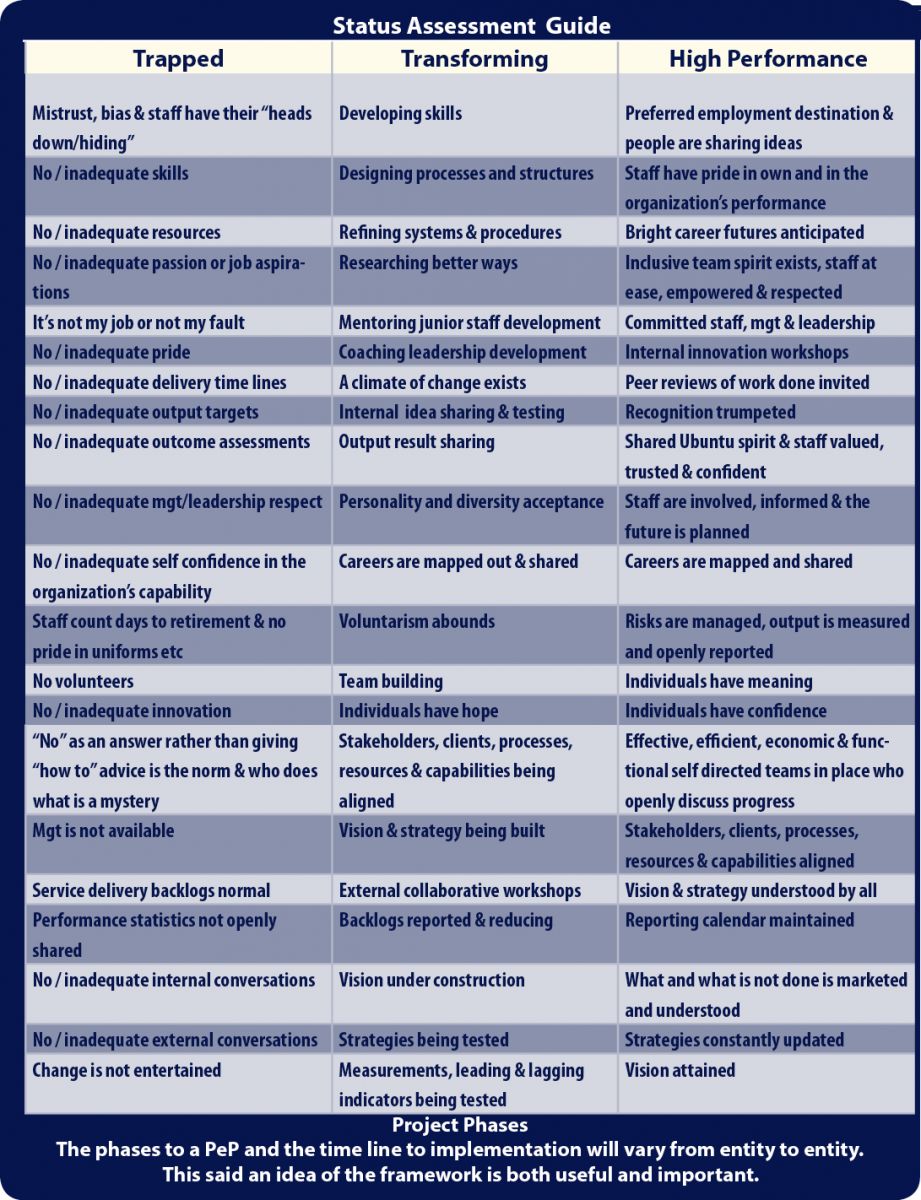
Chapter 4: Table 12: Status Assessment Guide | | |
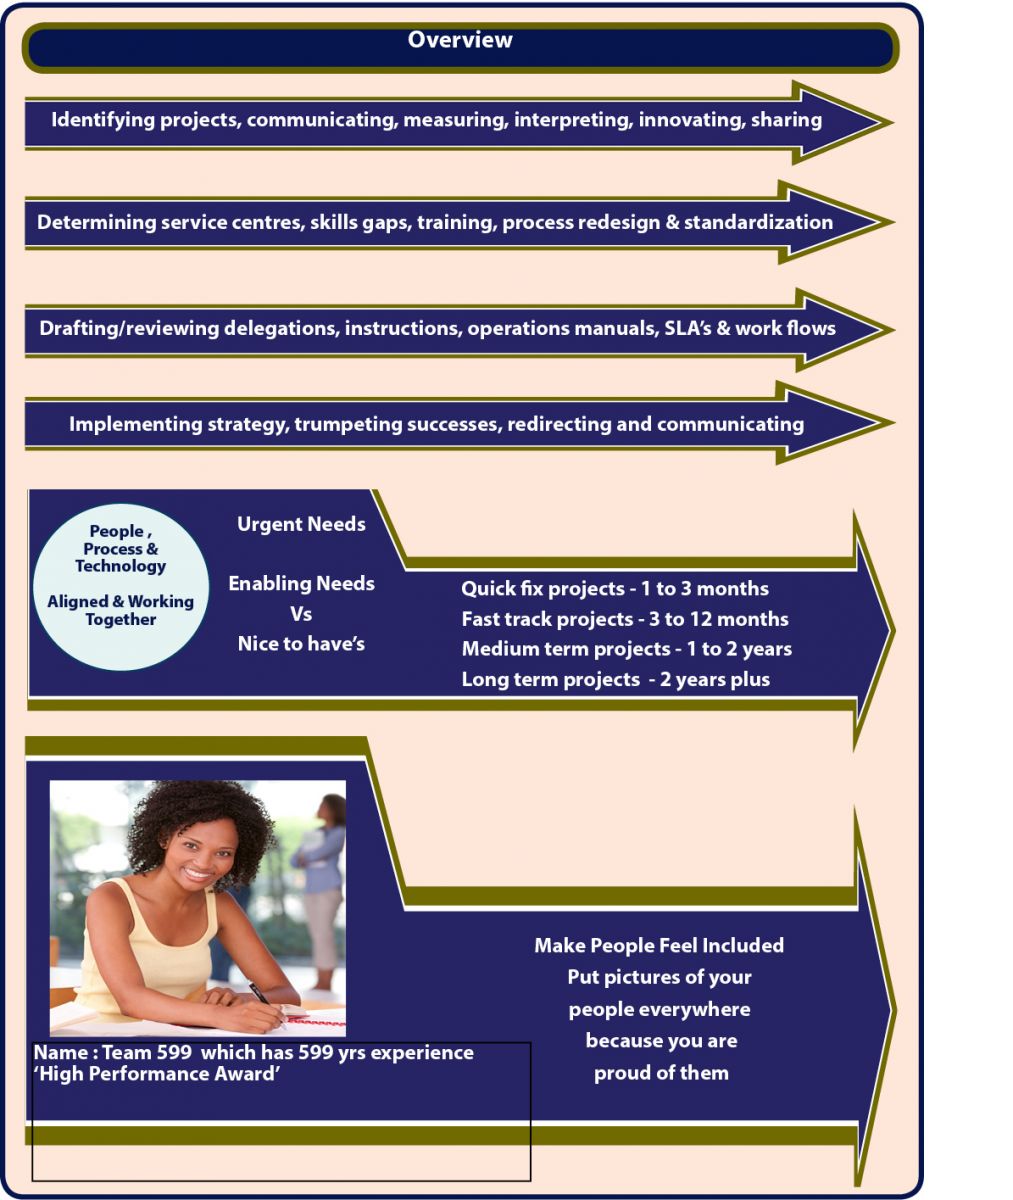
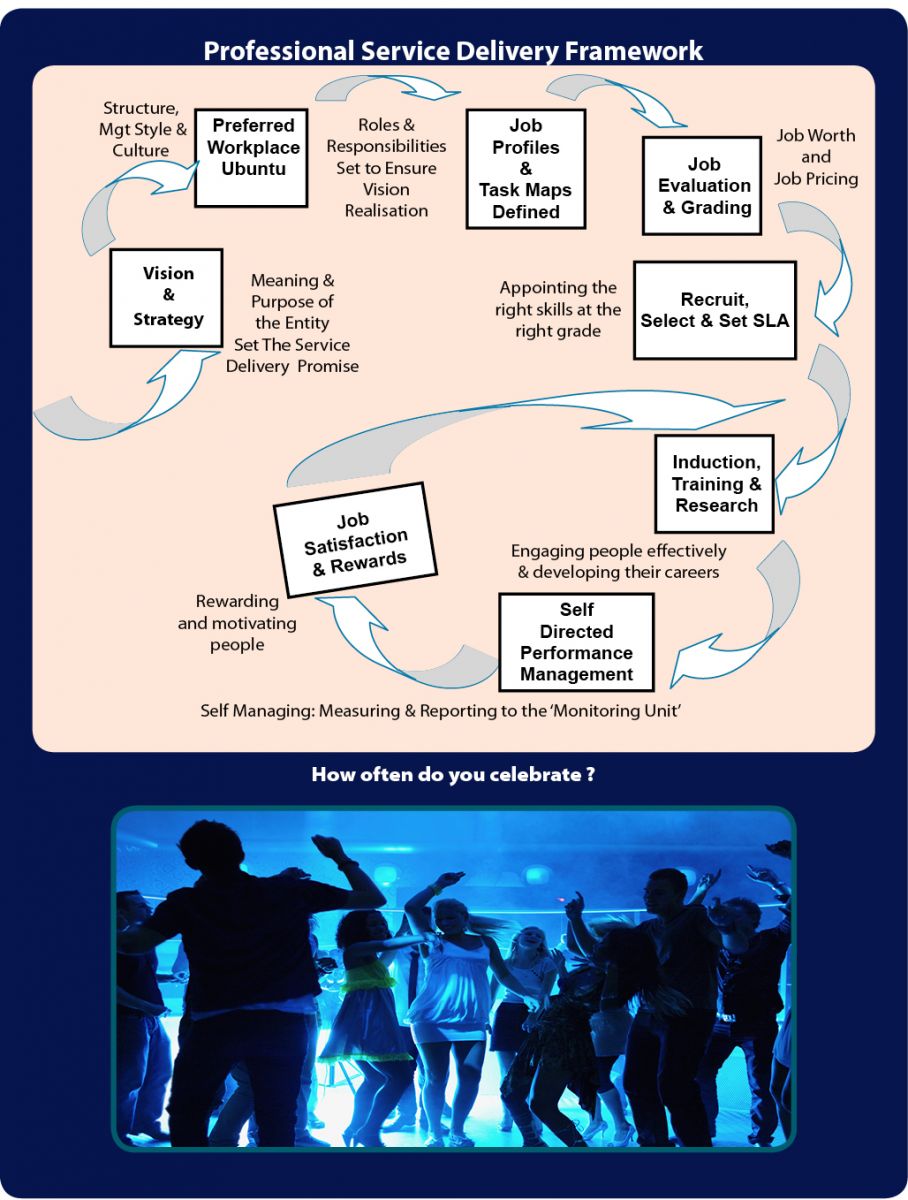
Chapter 4: Table 15: Reward Framework Option Examples, Table 13: To Do Overview and Table 14: Professional Service Delivery Framework | | |
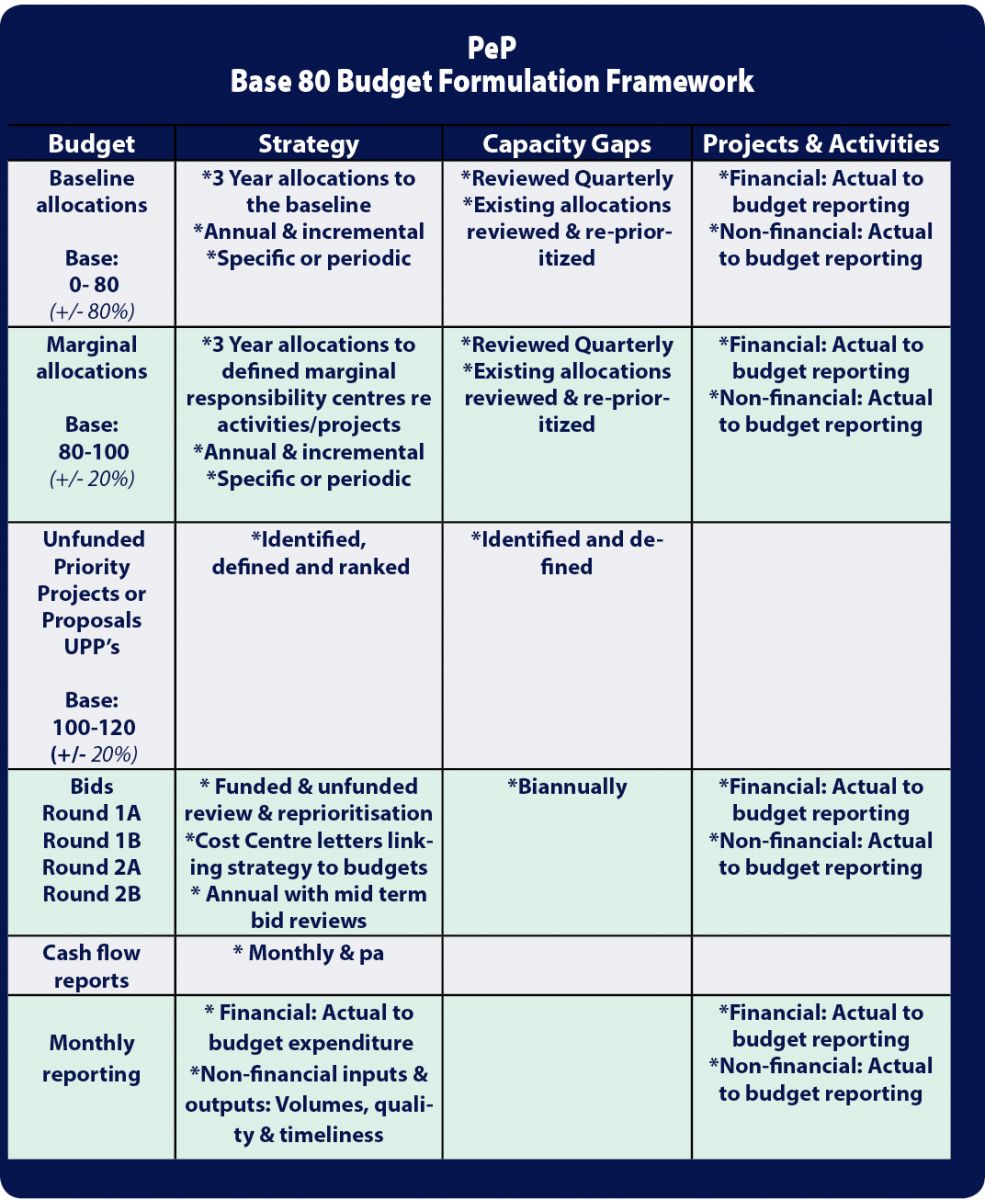
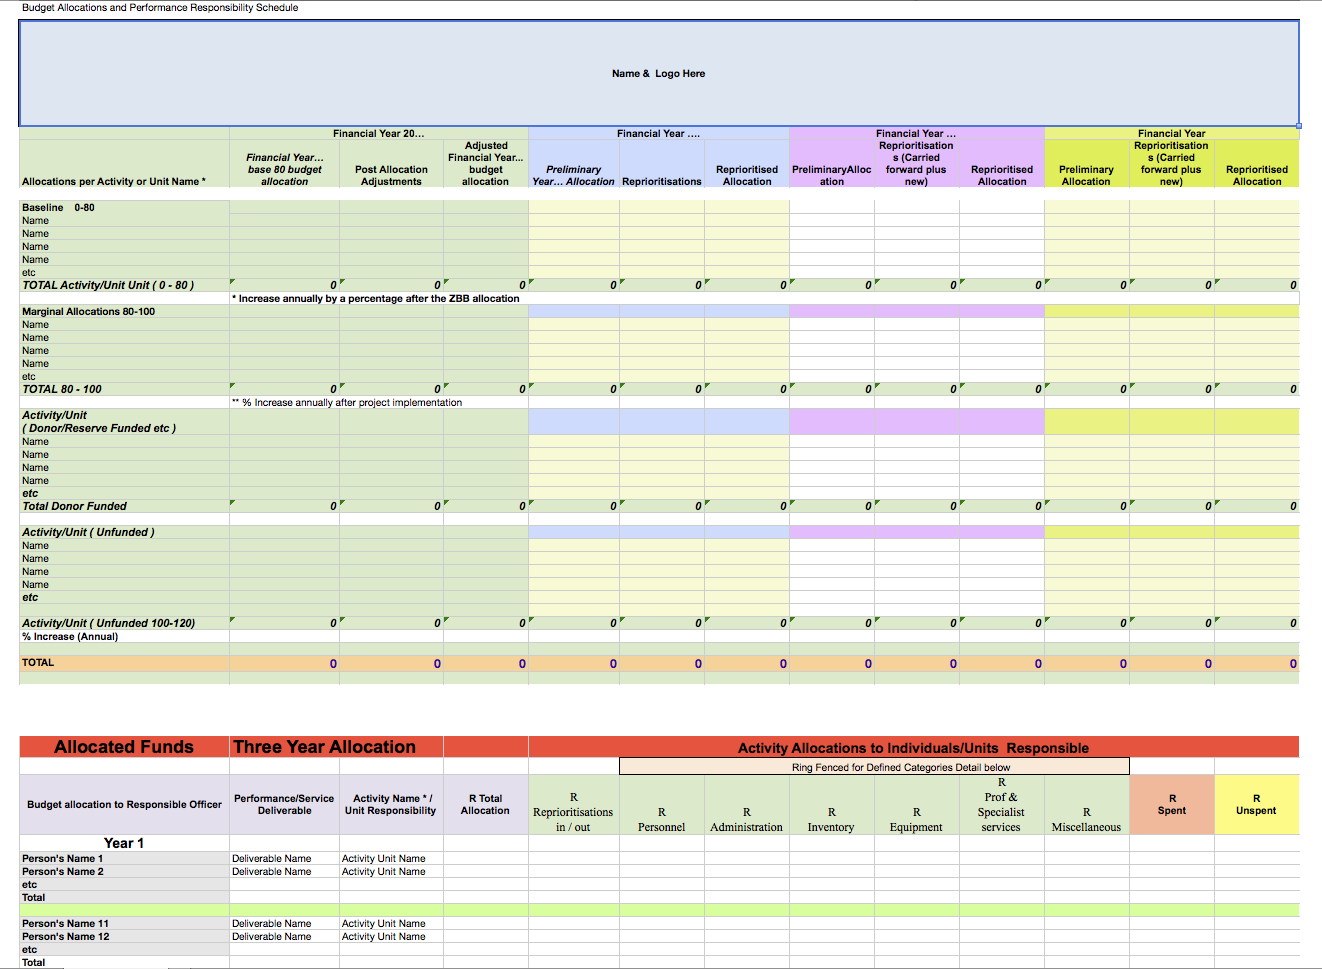
Chapter 6: Table 16: Base 80 Budget Formulation Framework | | |
Chapter 6: Table 17: Round 1A: Project / Process Enhancement Recommendation or Problem Report | | |
Chapter 6: Table 18: Round 1B: Possible Unfunded New Projects/activities Charter (100-120) & "Base 80" Marginally Funded Projects/Activities (80-100) Report | | |
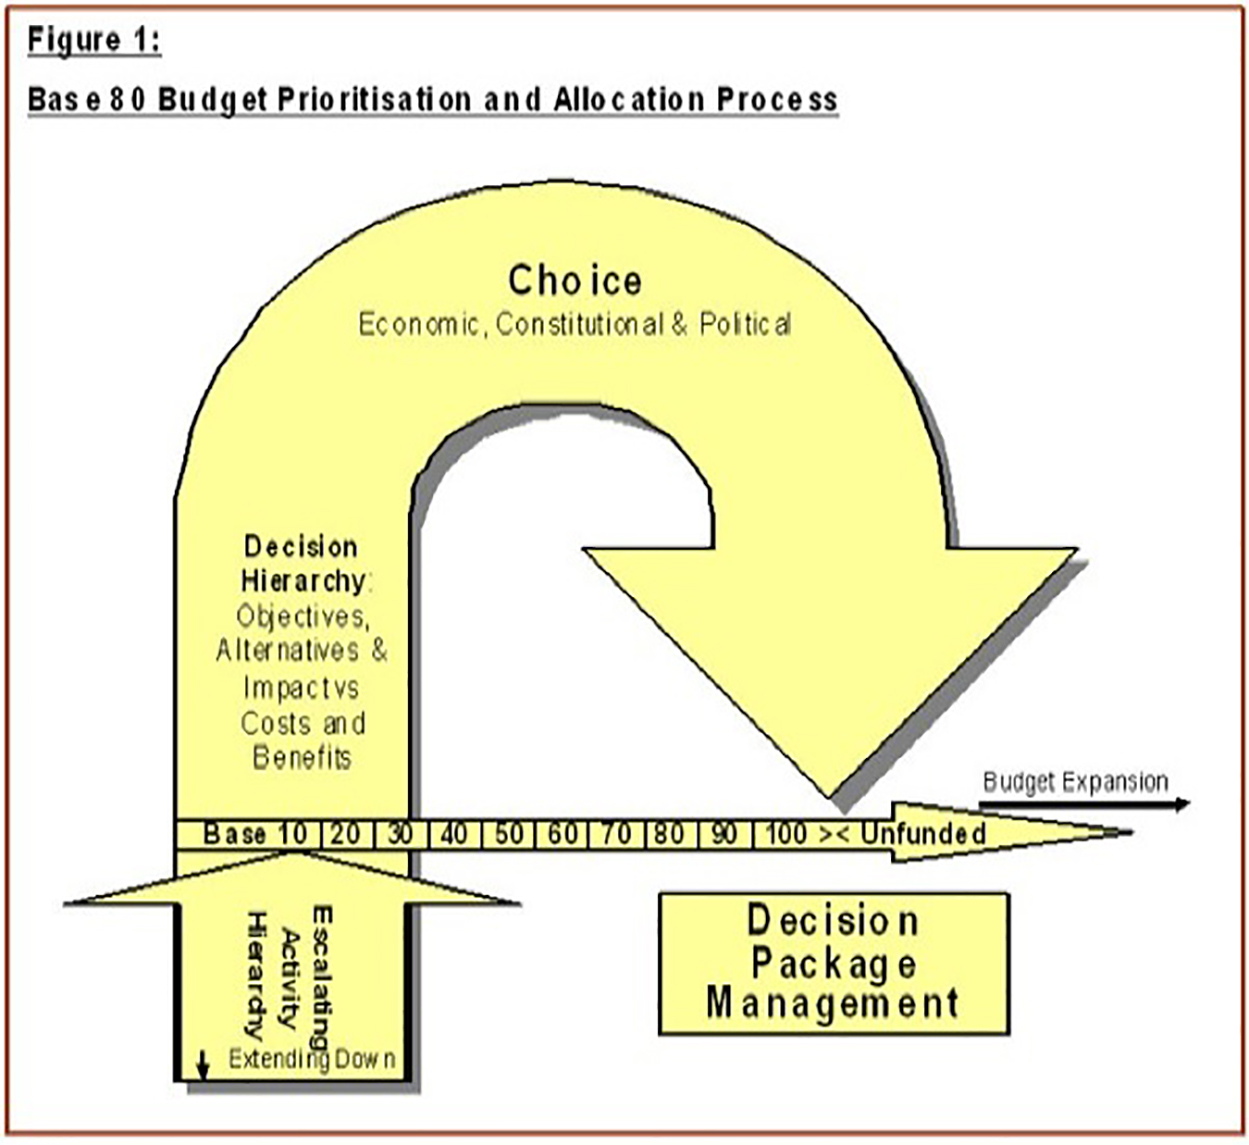
Chapter 8: Implementation Case Study Figure 1 - Base 80 Budget Prioritisation and Allocation Process | | |
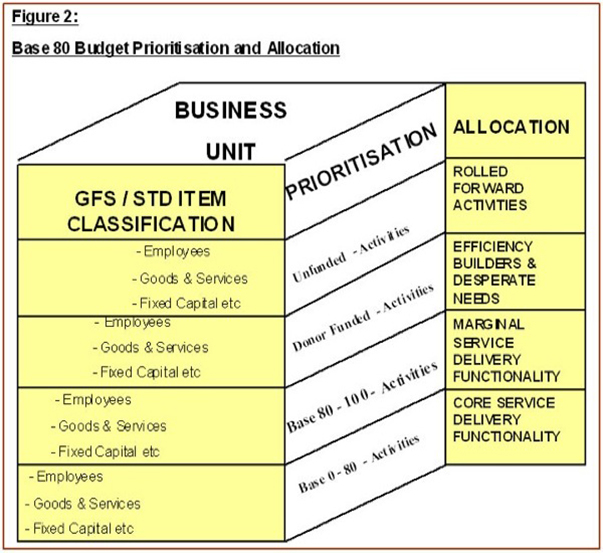
Figure 2 - Base 80 Budget Prioritisation and Allocation | | |
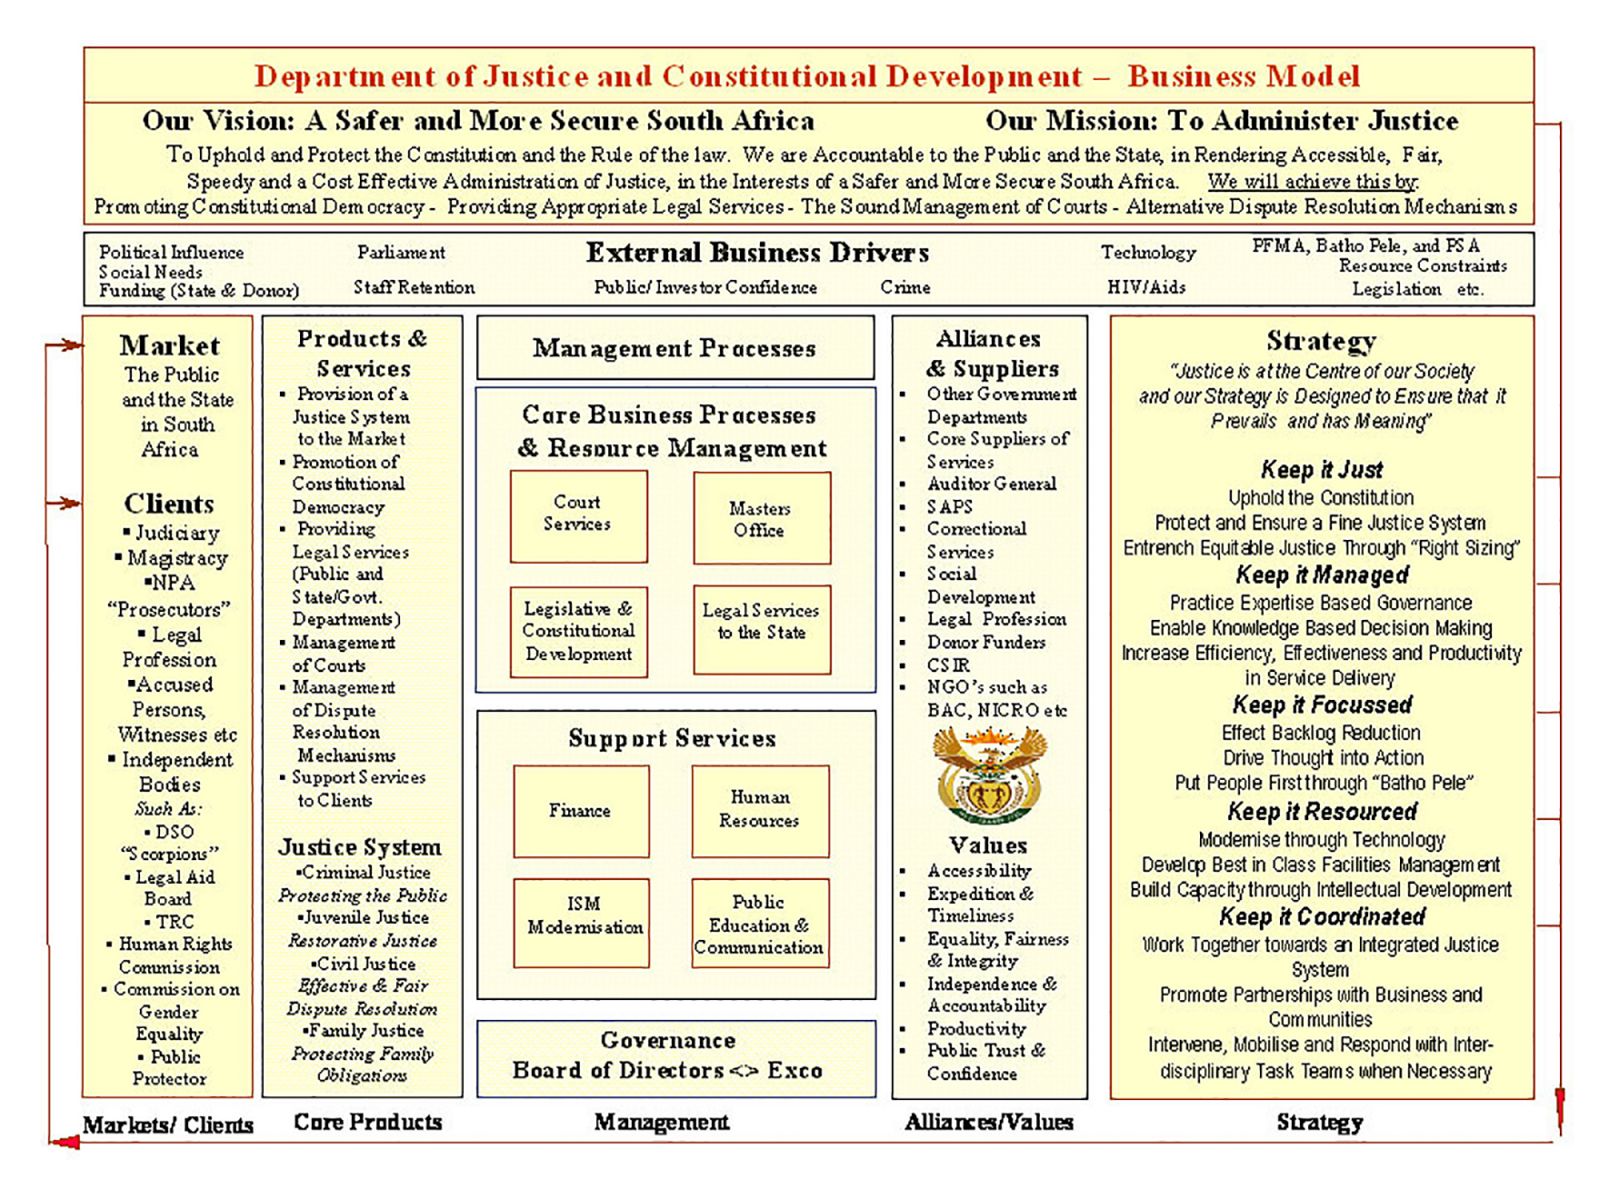
Figure 3 - Business Model | | |
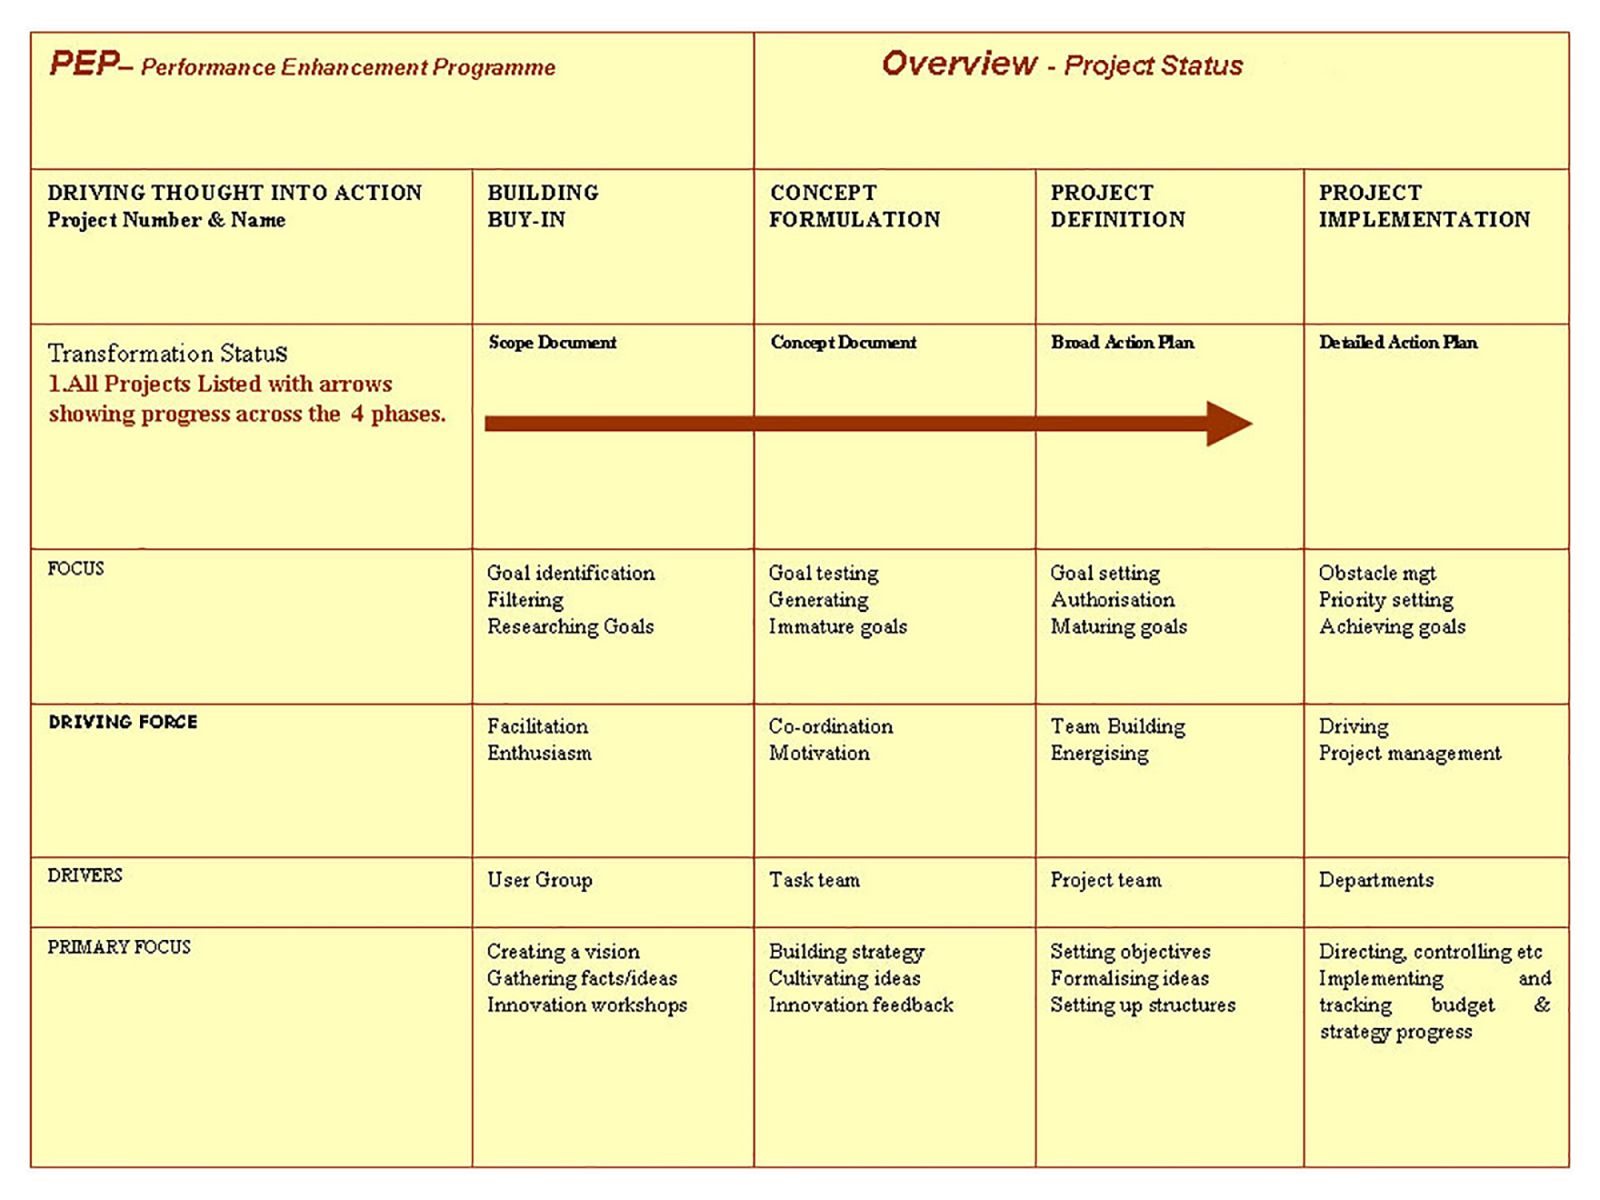
Figure 4 - Transformation Phases | | |
Figure 5 - Project Reporting | | |
Appendix 1: Spreadsheet and Other Downloads Business Model Template (.xls) | | |
Base 80 Budget Allocation Template (.xls) | | |
Project Development Status Report (.xls) | | |
Process Mapping Template (.xls) | | |
Project Measurables Report Template (.xls) | | |
Bonus Chapter: PeP Infographic | | |


.jpg)

.jpg)


.jpg)


.png)